CREATIVE AND DESIGN DIRECTION
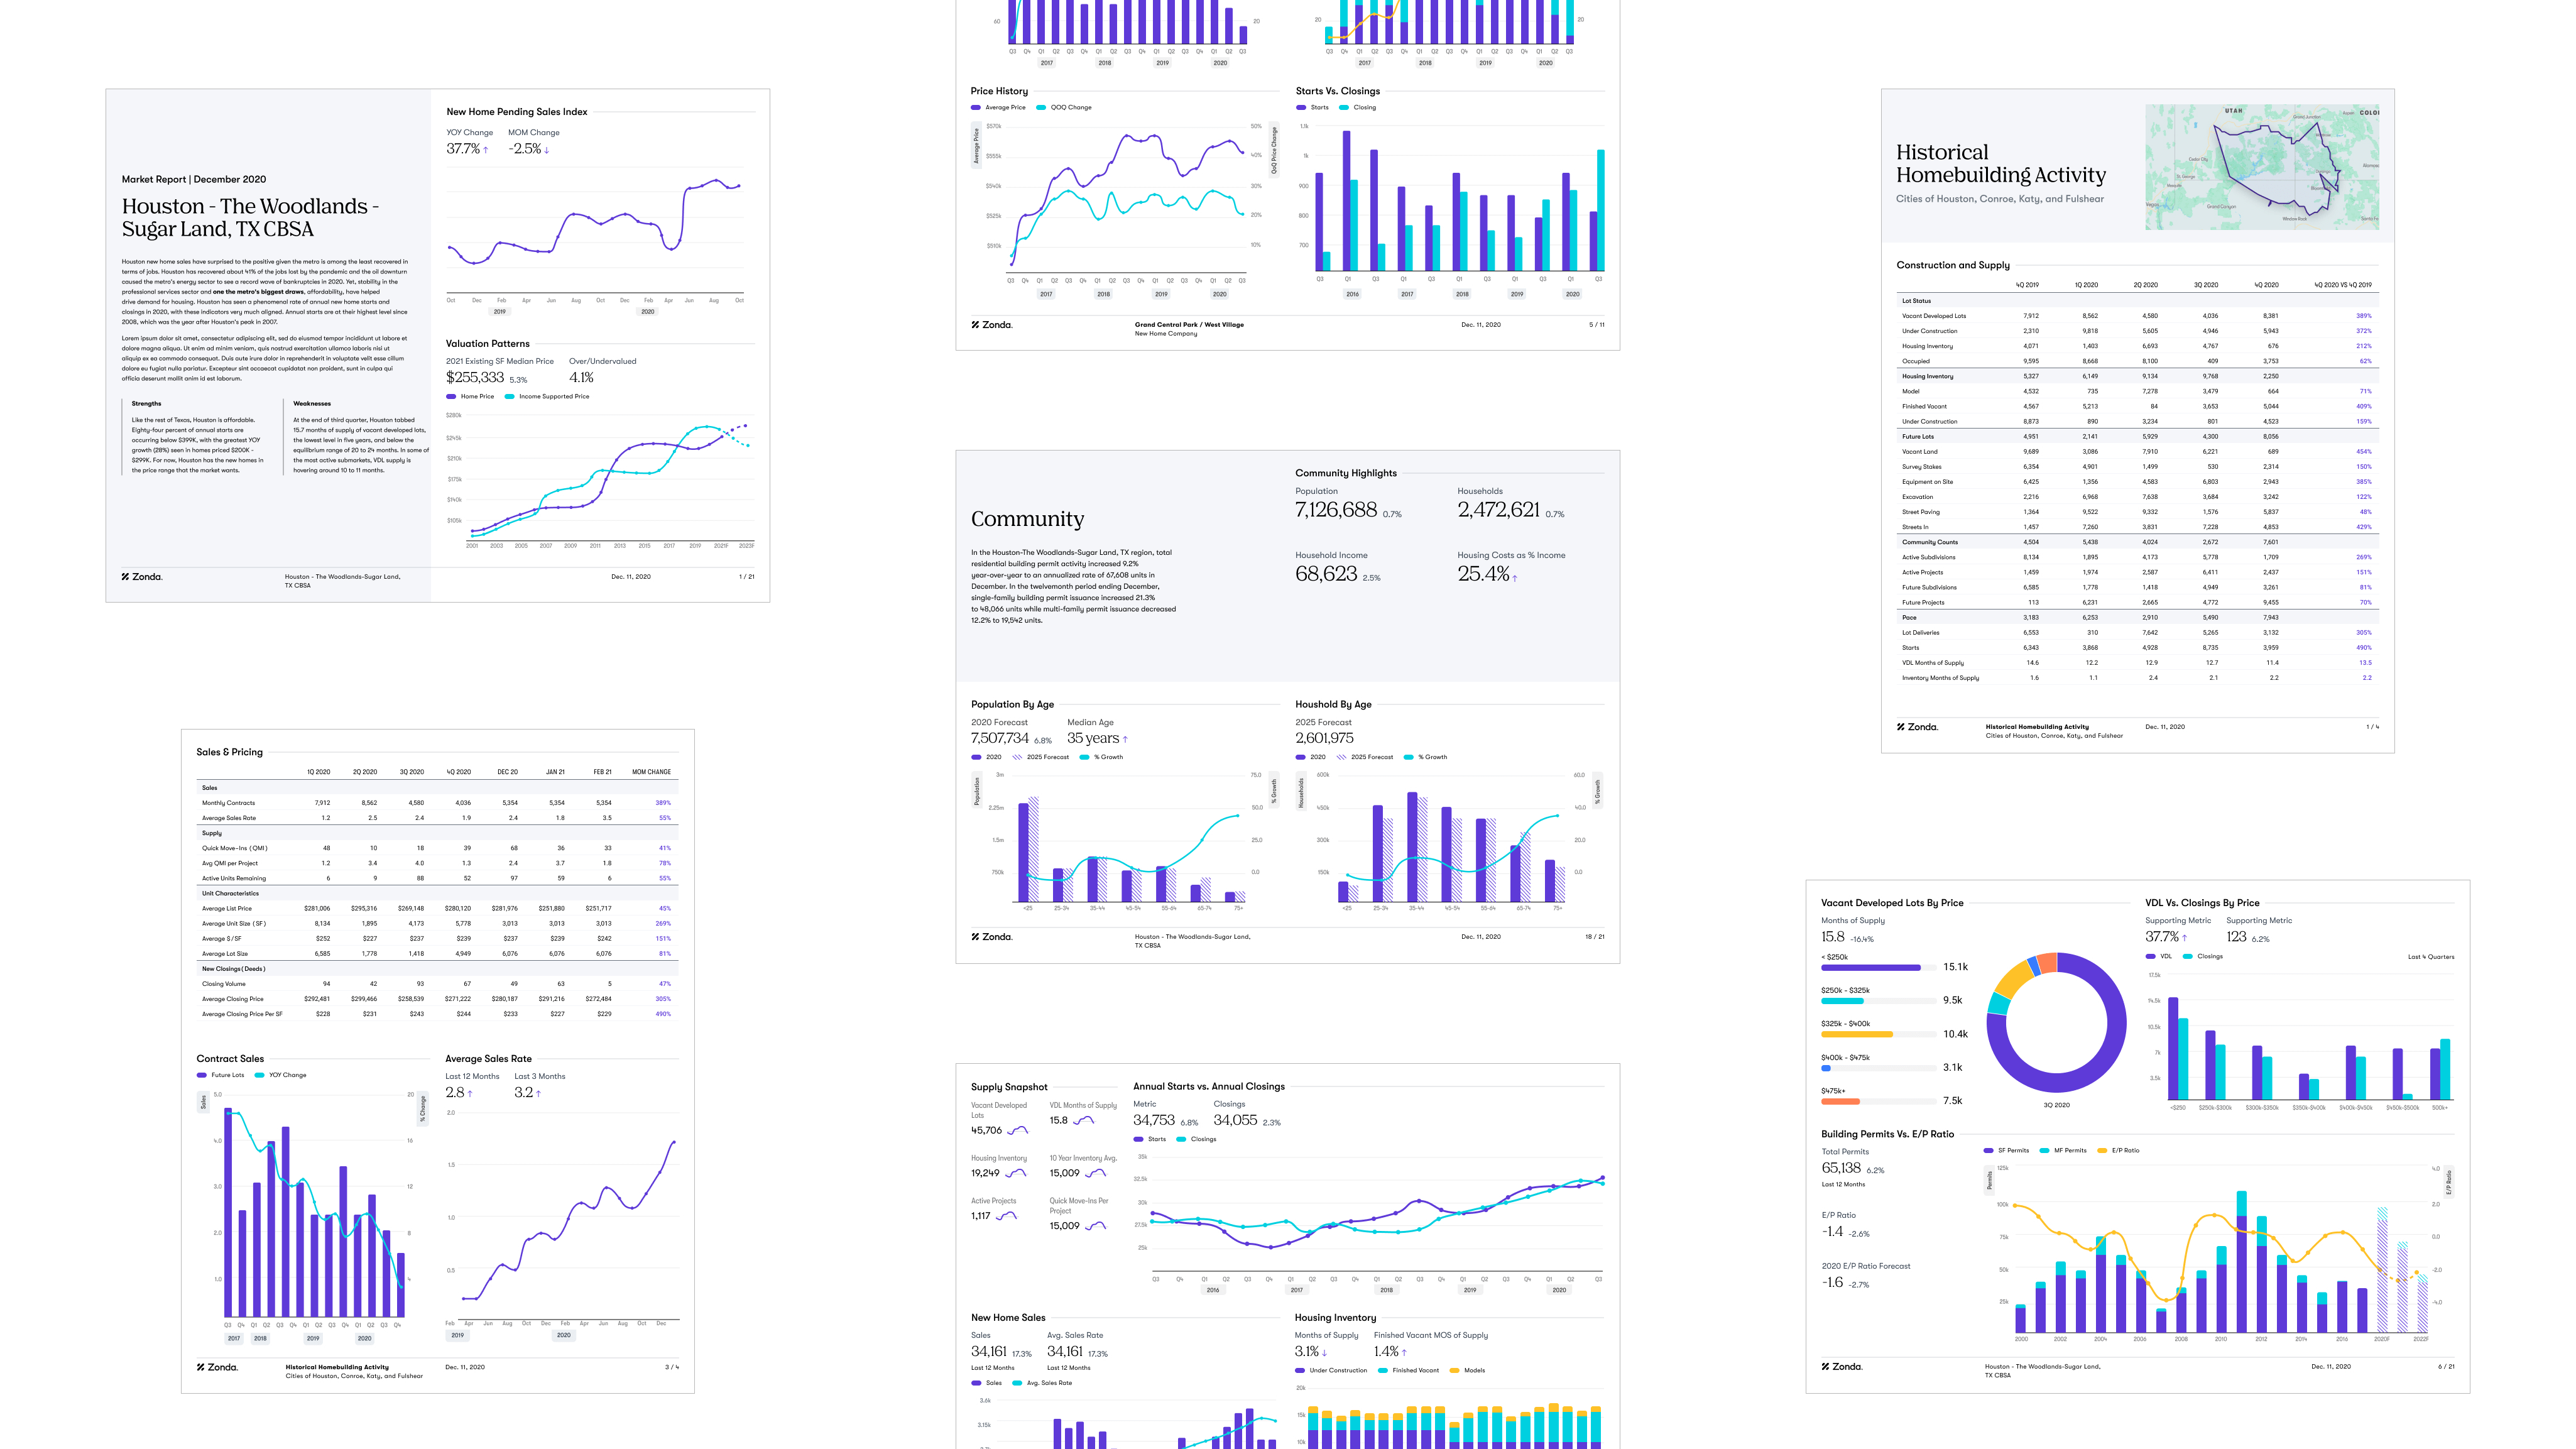
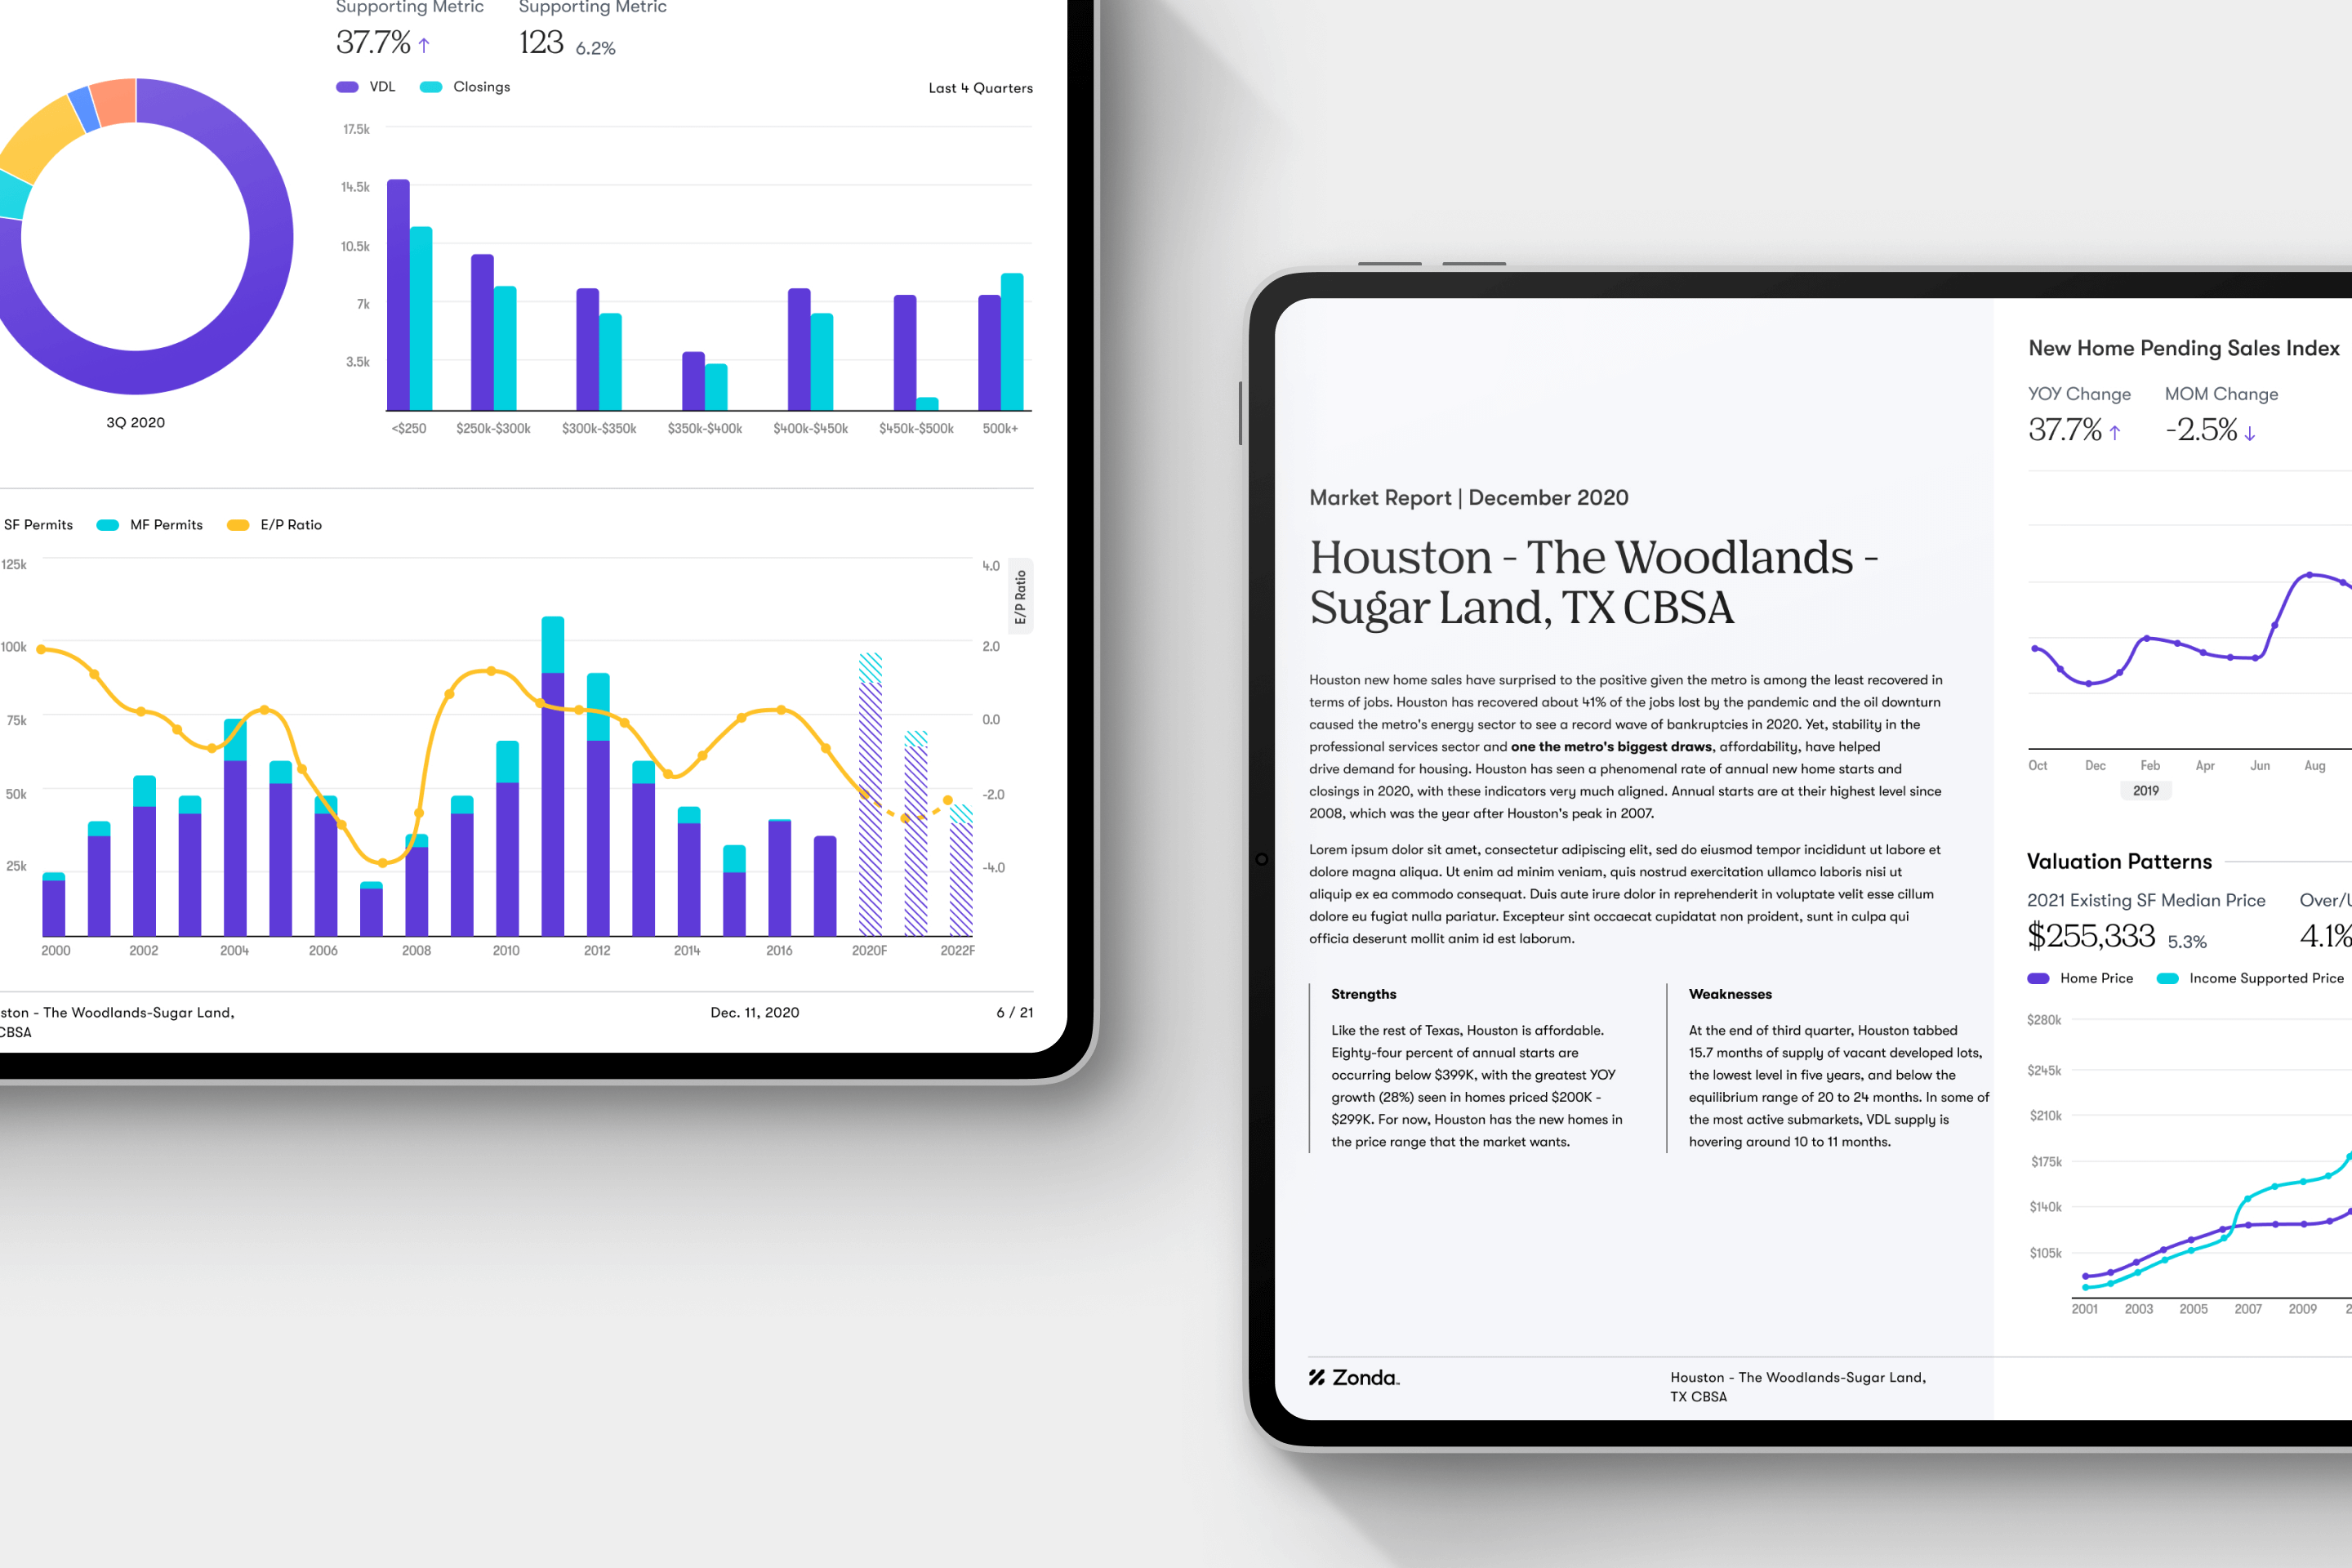
Zonda exists to inform, advise and connect the next generation of housing industry experts with critial insights and real-time data. We developed and documented a fully articulated design system for how all data visuals show up within Zonda products.
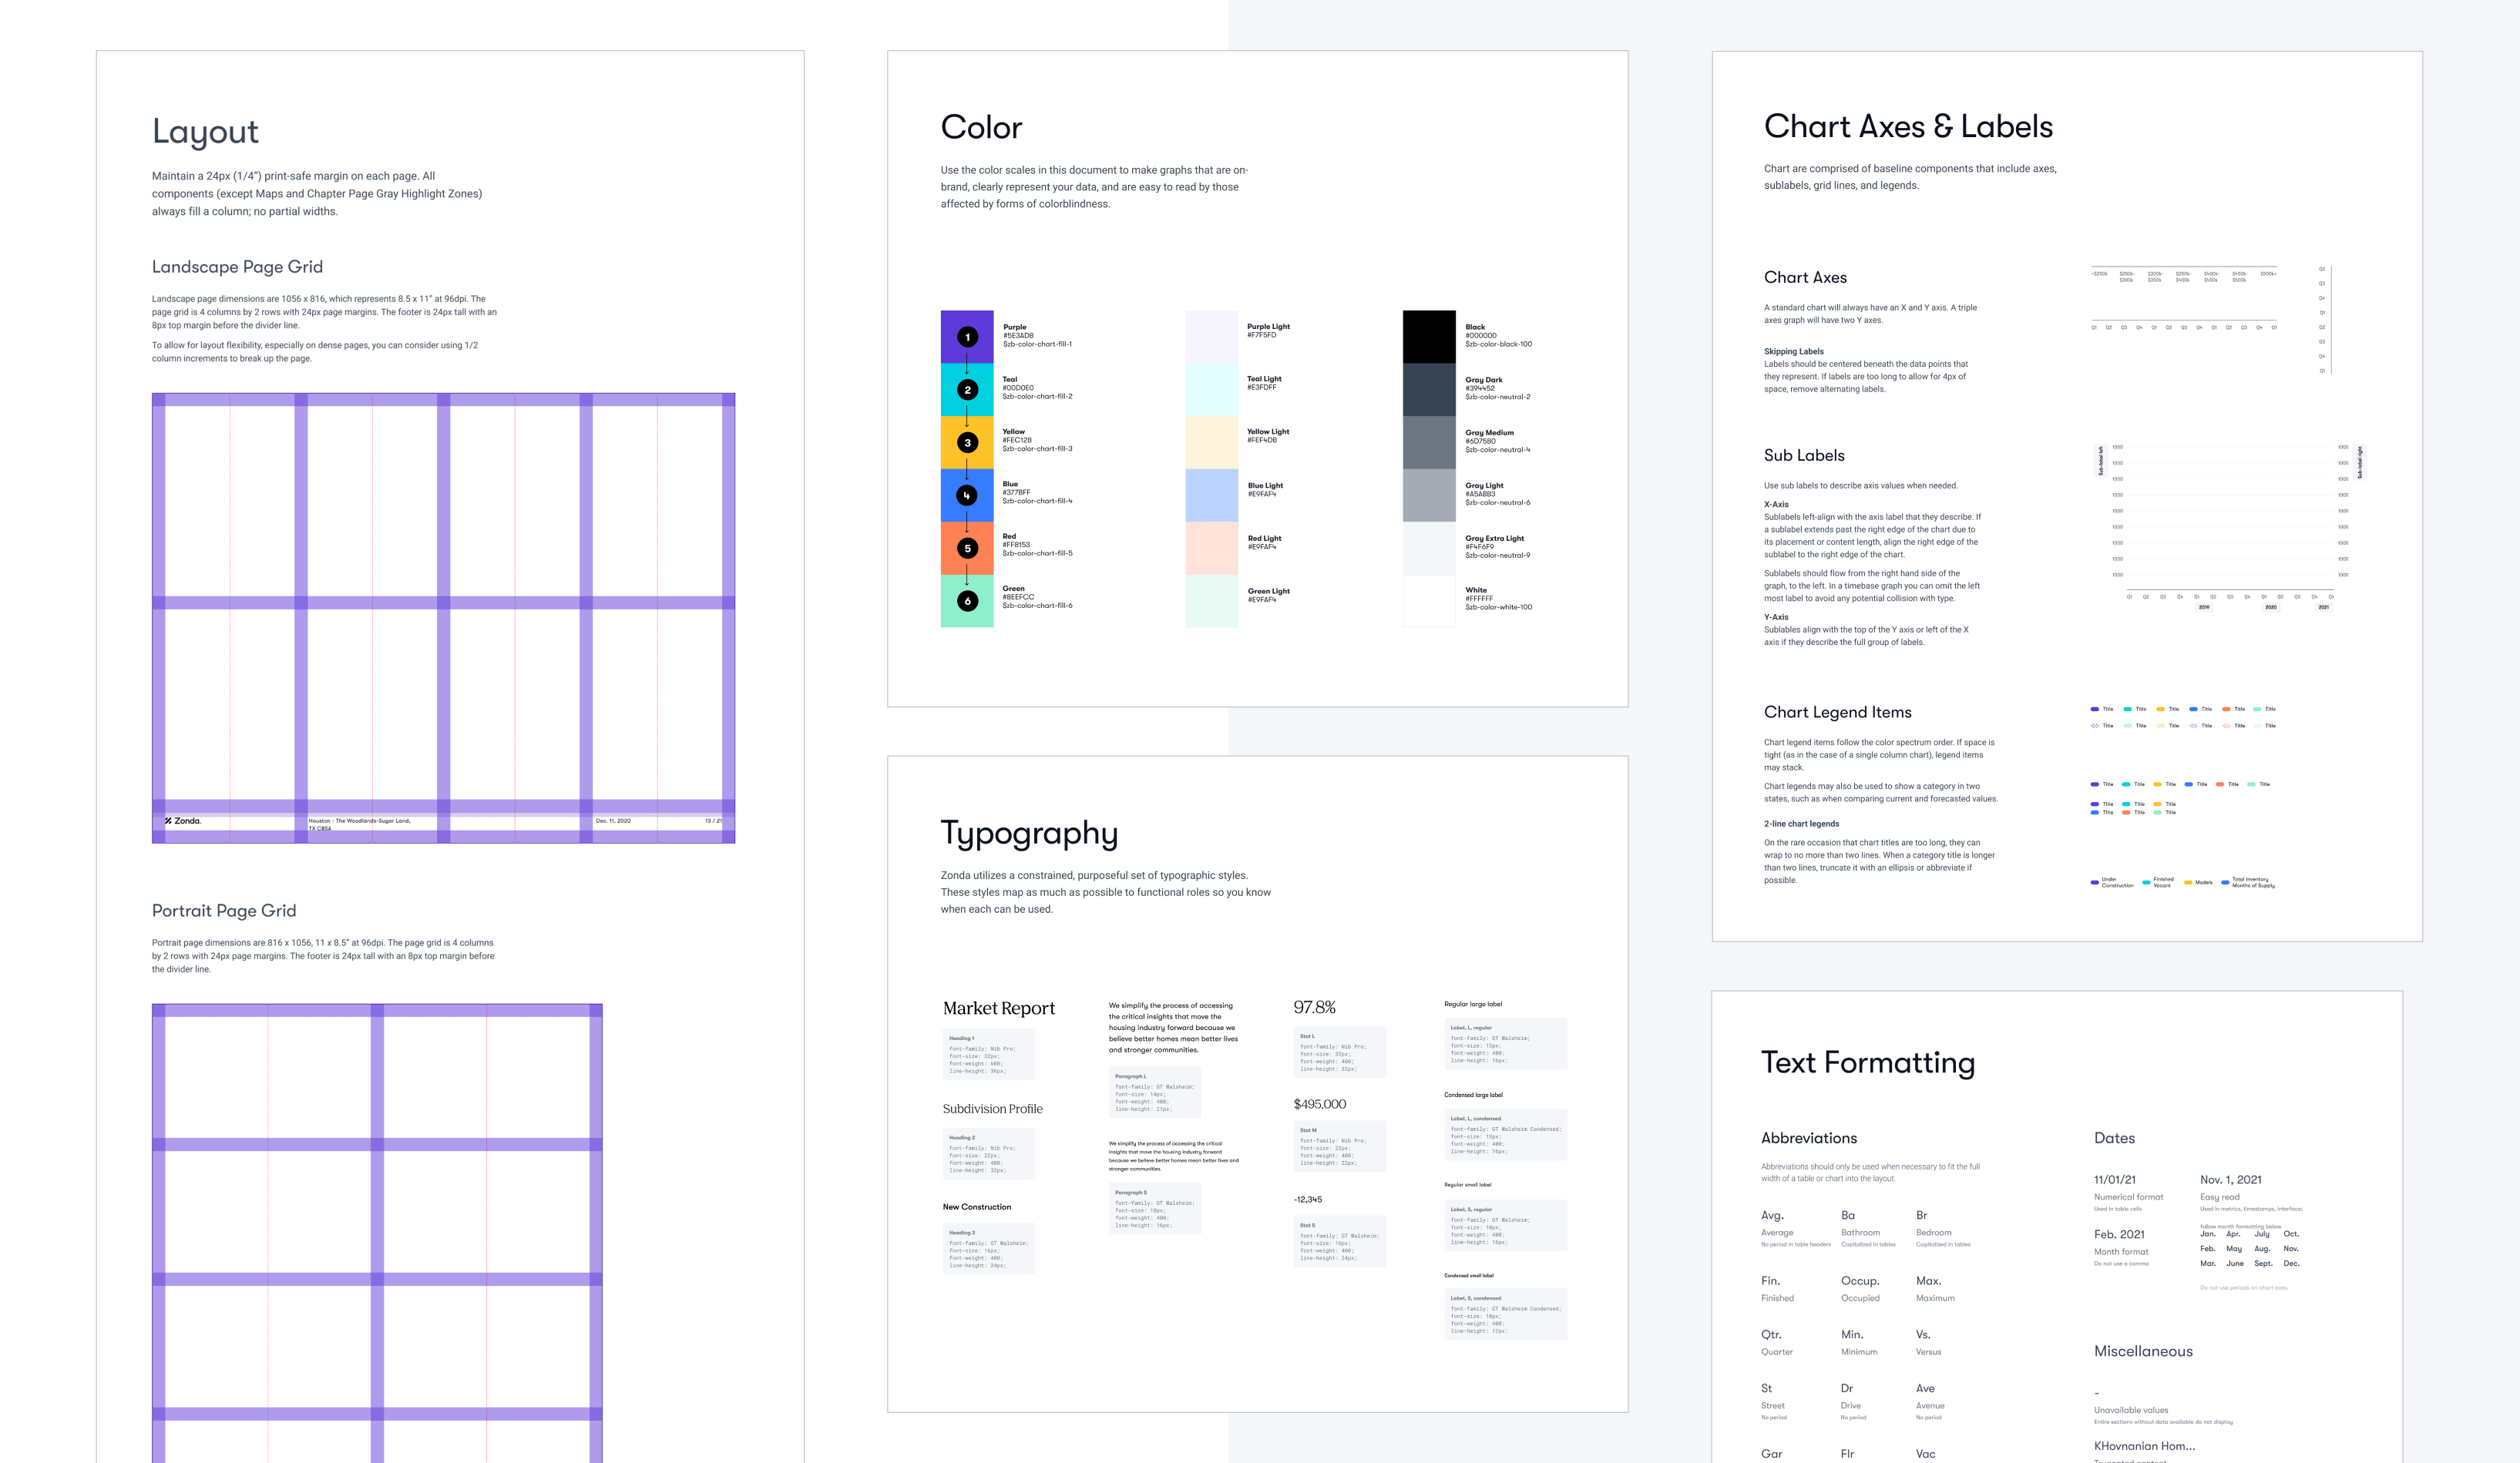
Designing for a system that scales across all data inputs. The design system includes bars, lines, combined, plotting and pie charts. They were all built in multiple variants and sizes in order to accommodate the min to max inputs. The system also included designs for various data types including negative, n/a, and forecasted data.
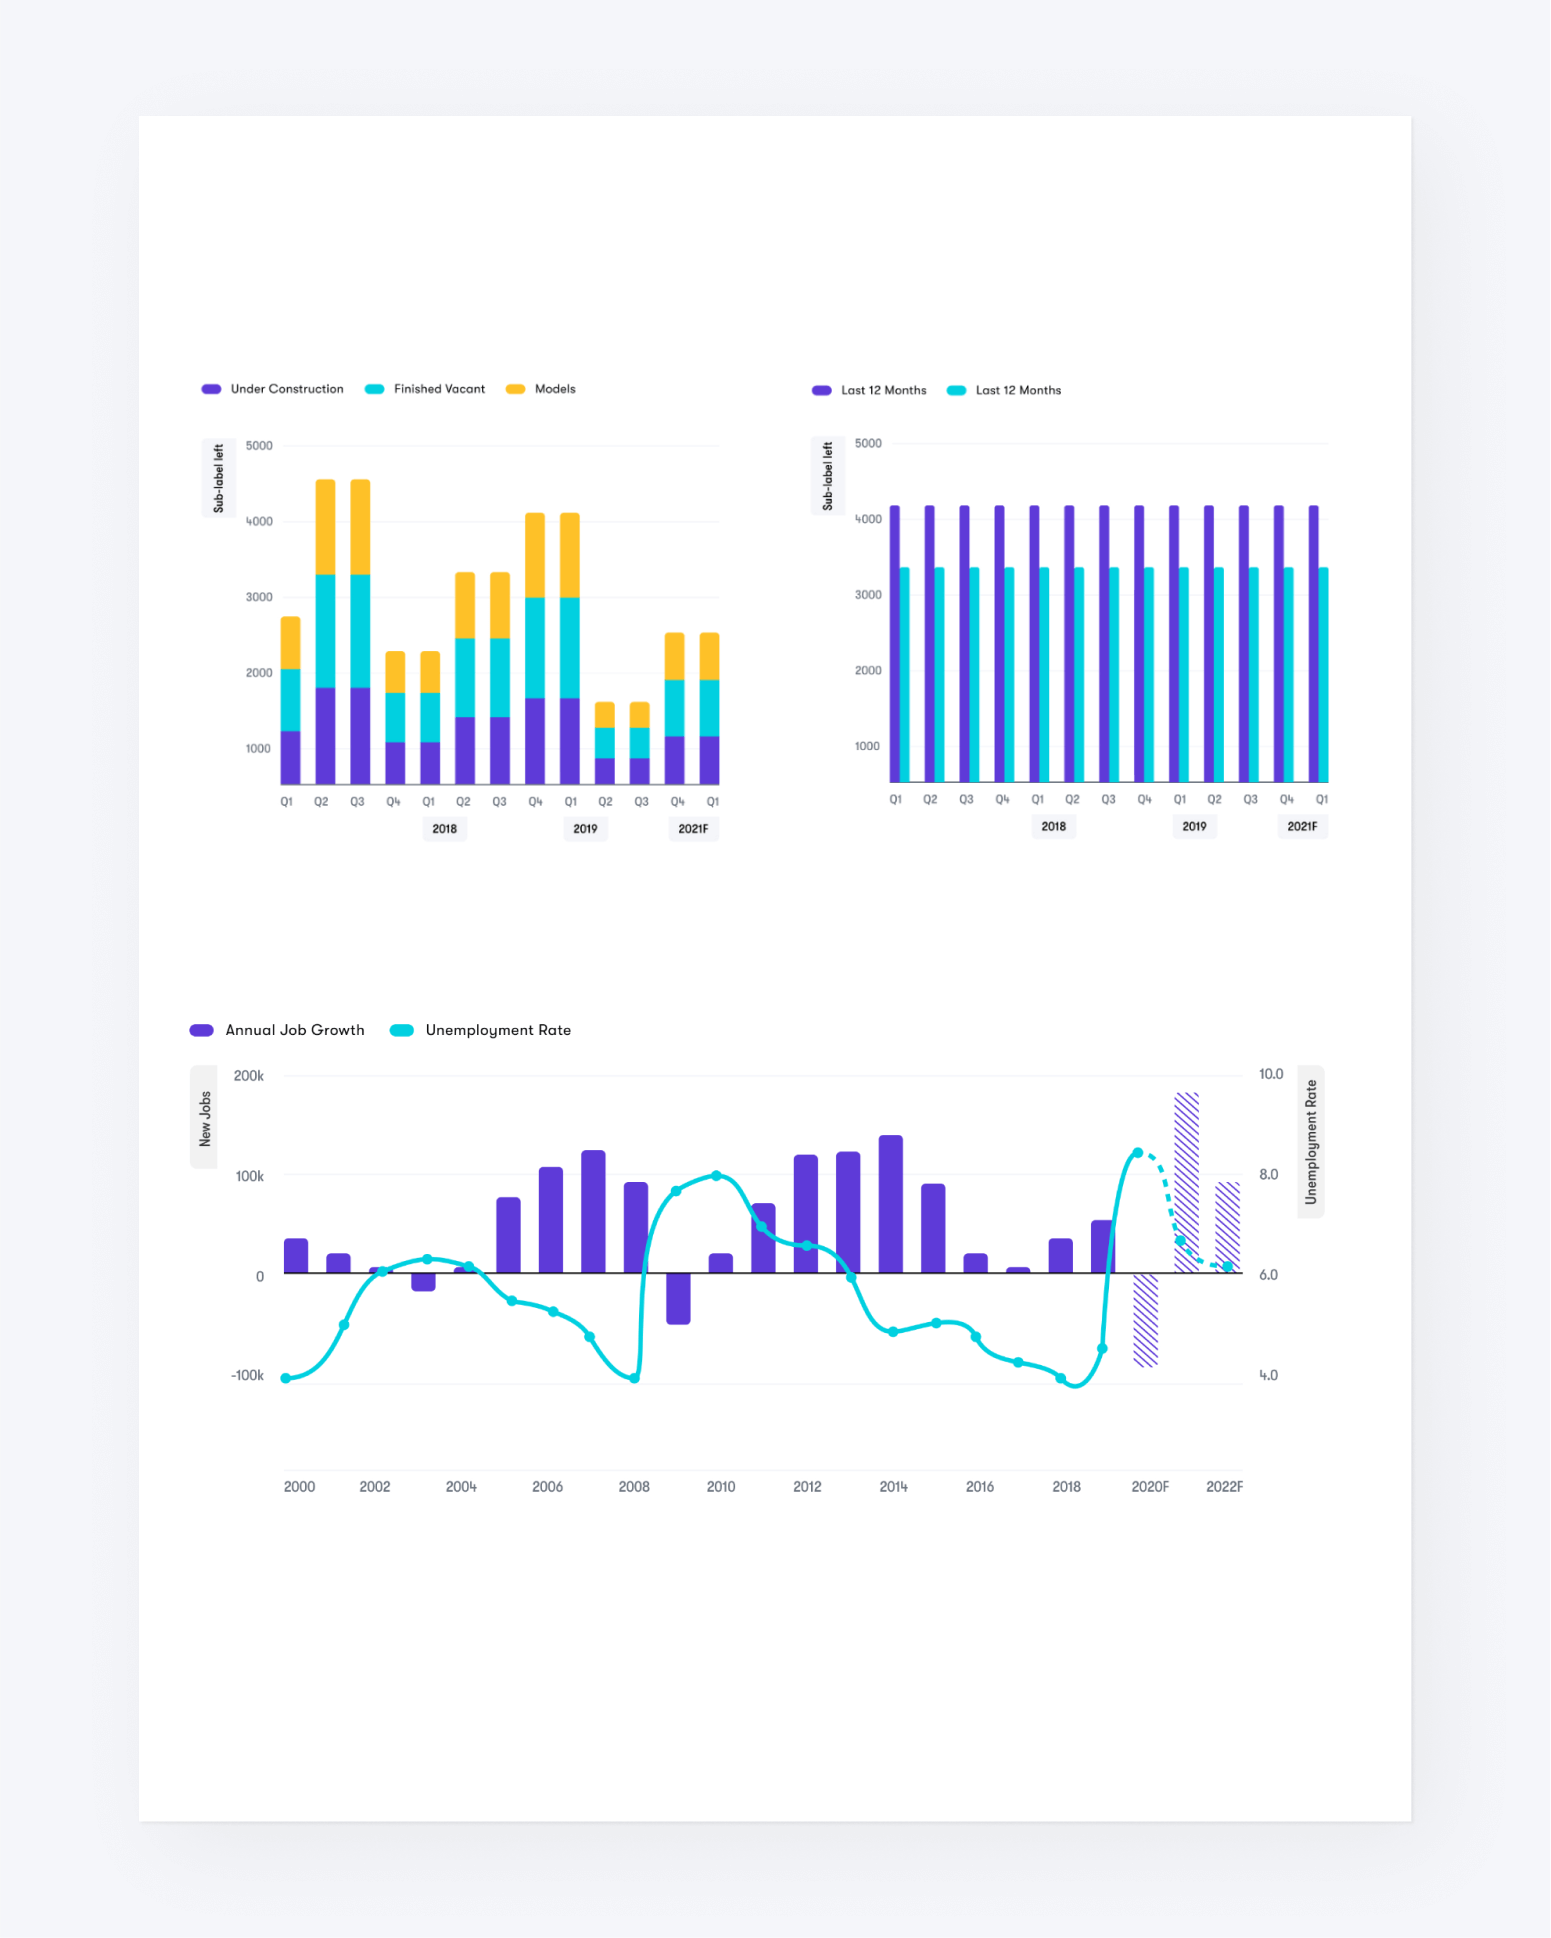
Bar charts designed to flex: standard, grouped, stacked, horizontal and combined.
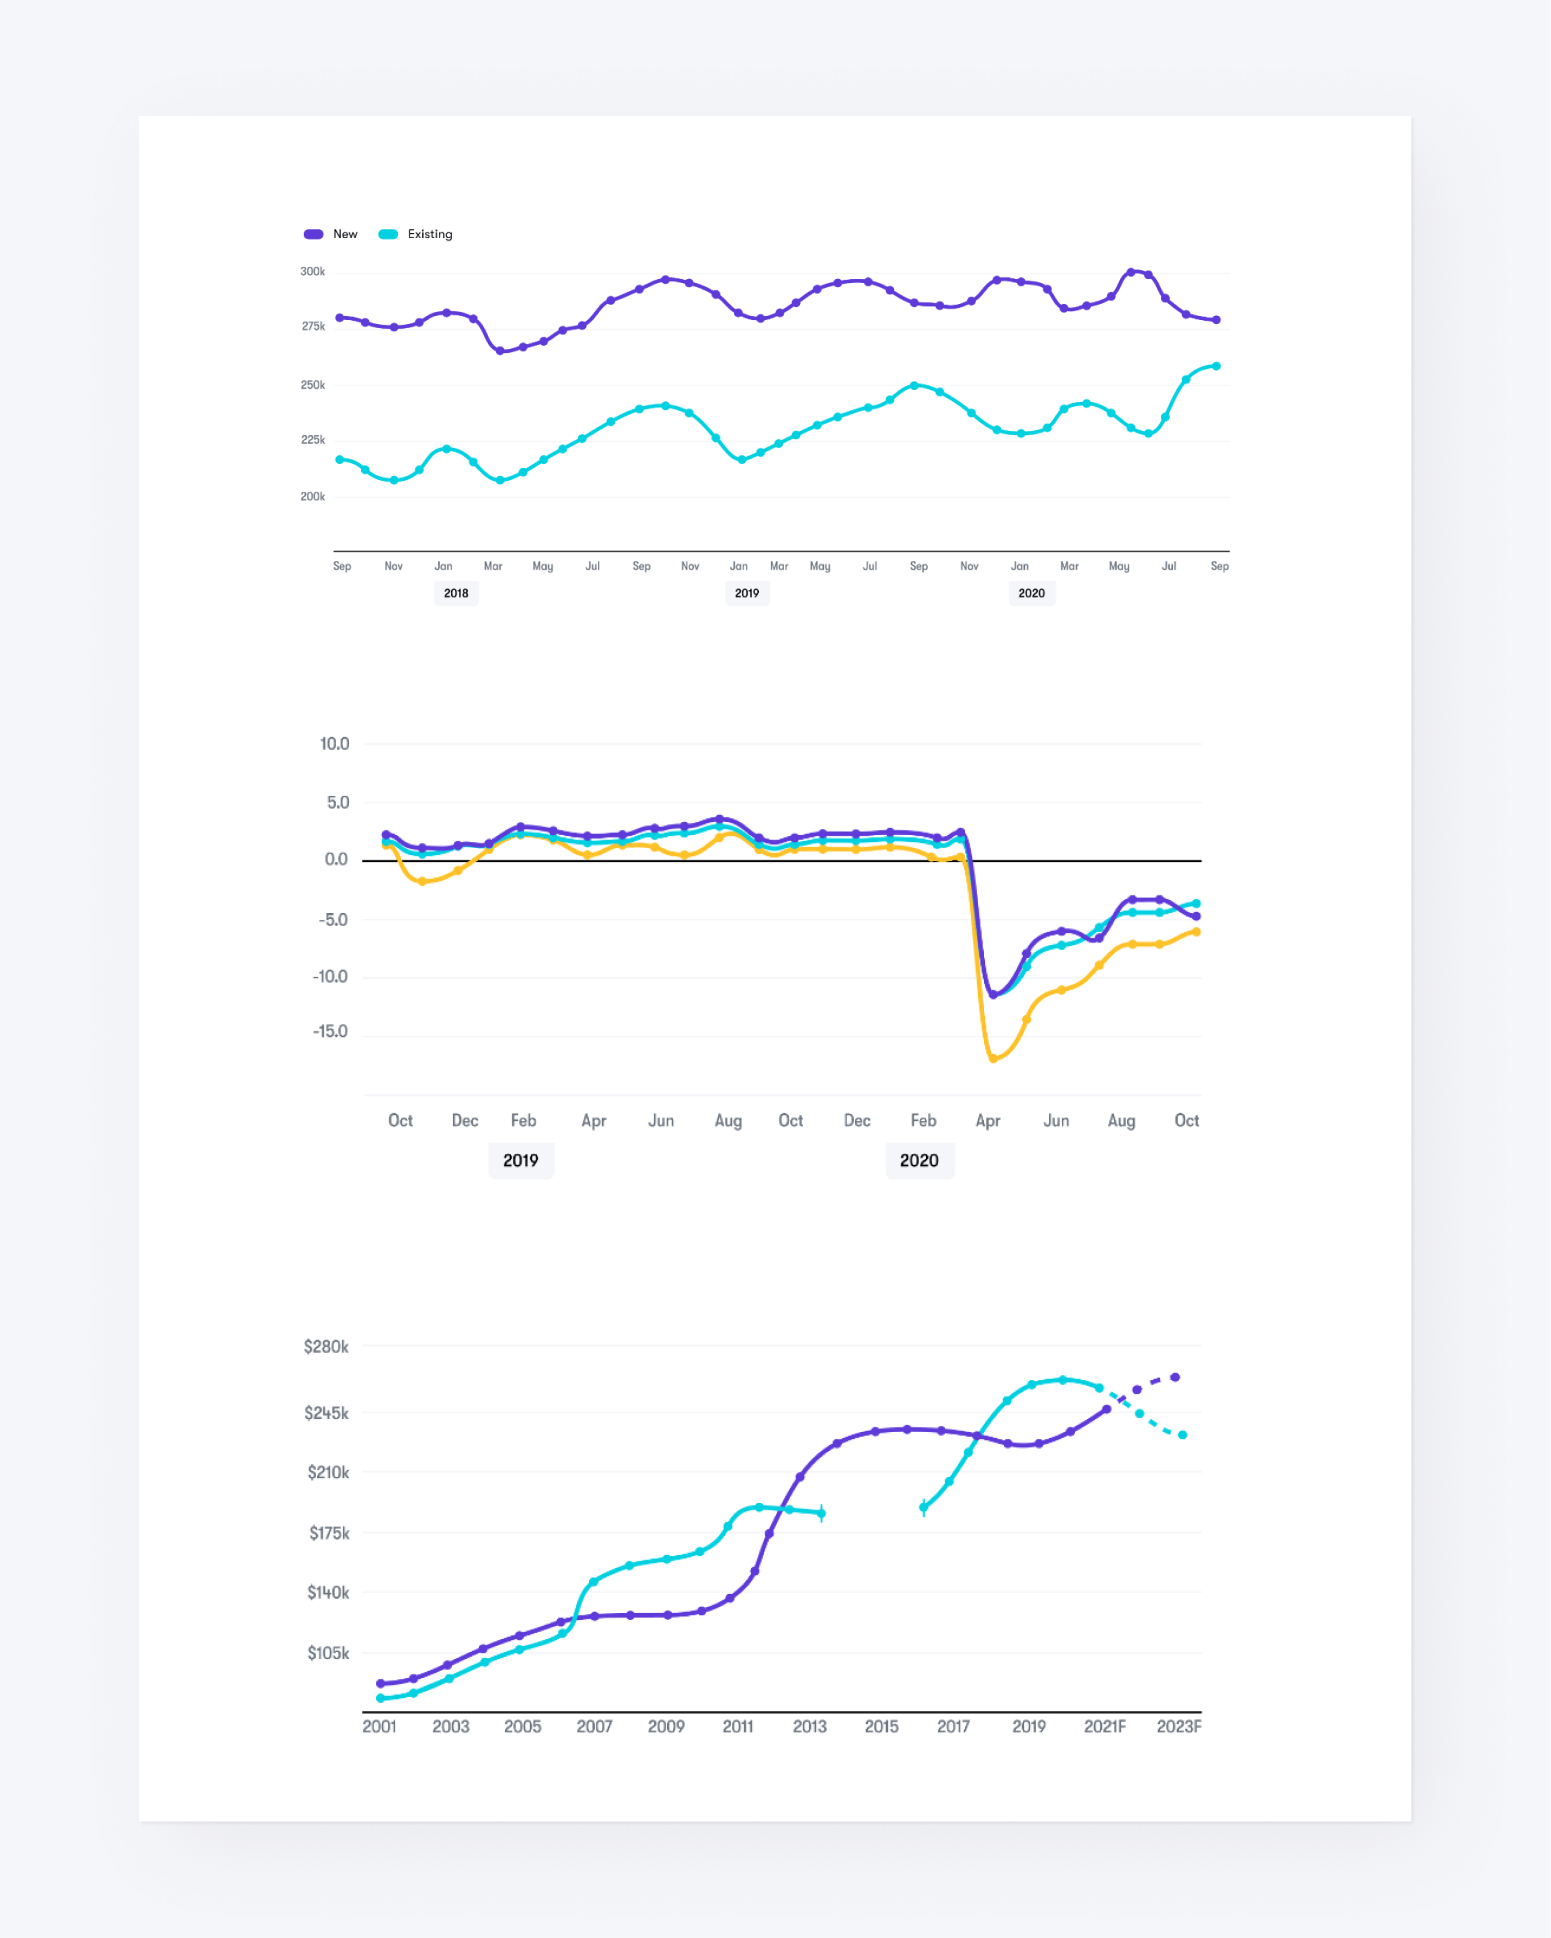
Line charts and positing charts needed flexibility to display forecasted, negative and N/A data.
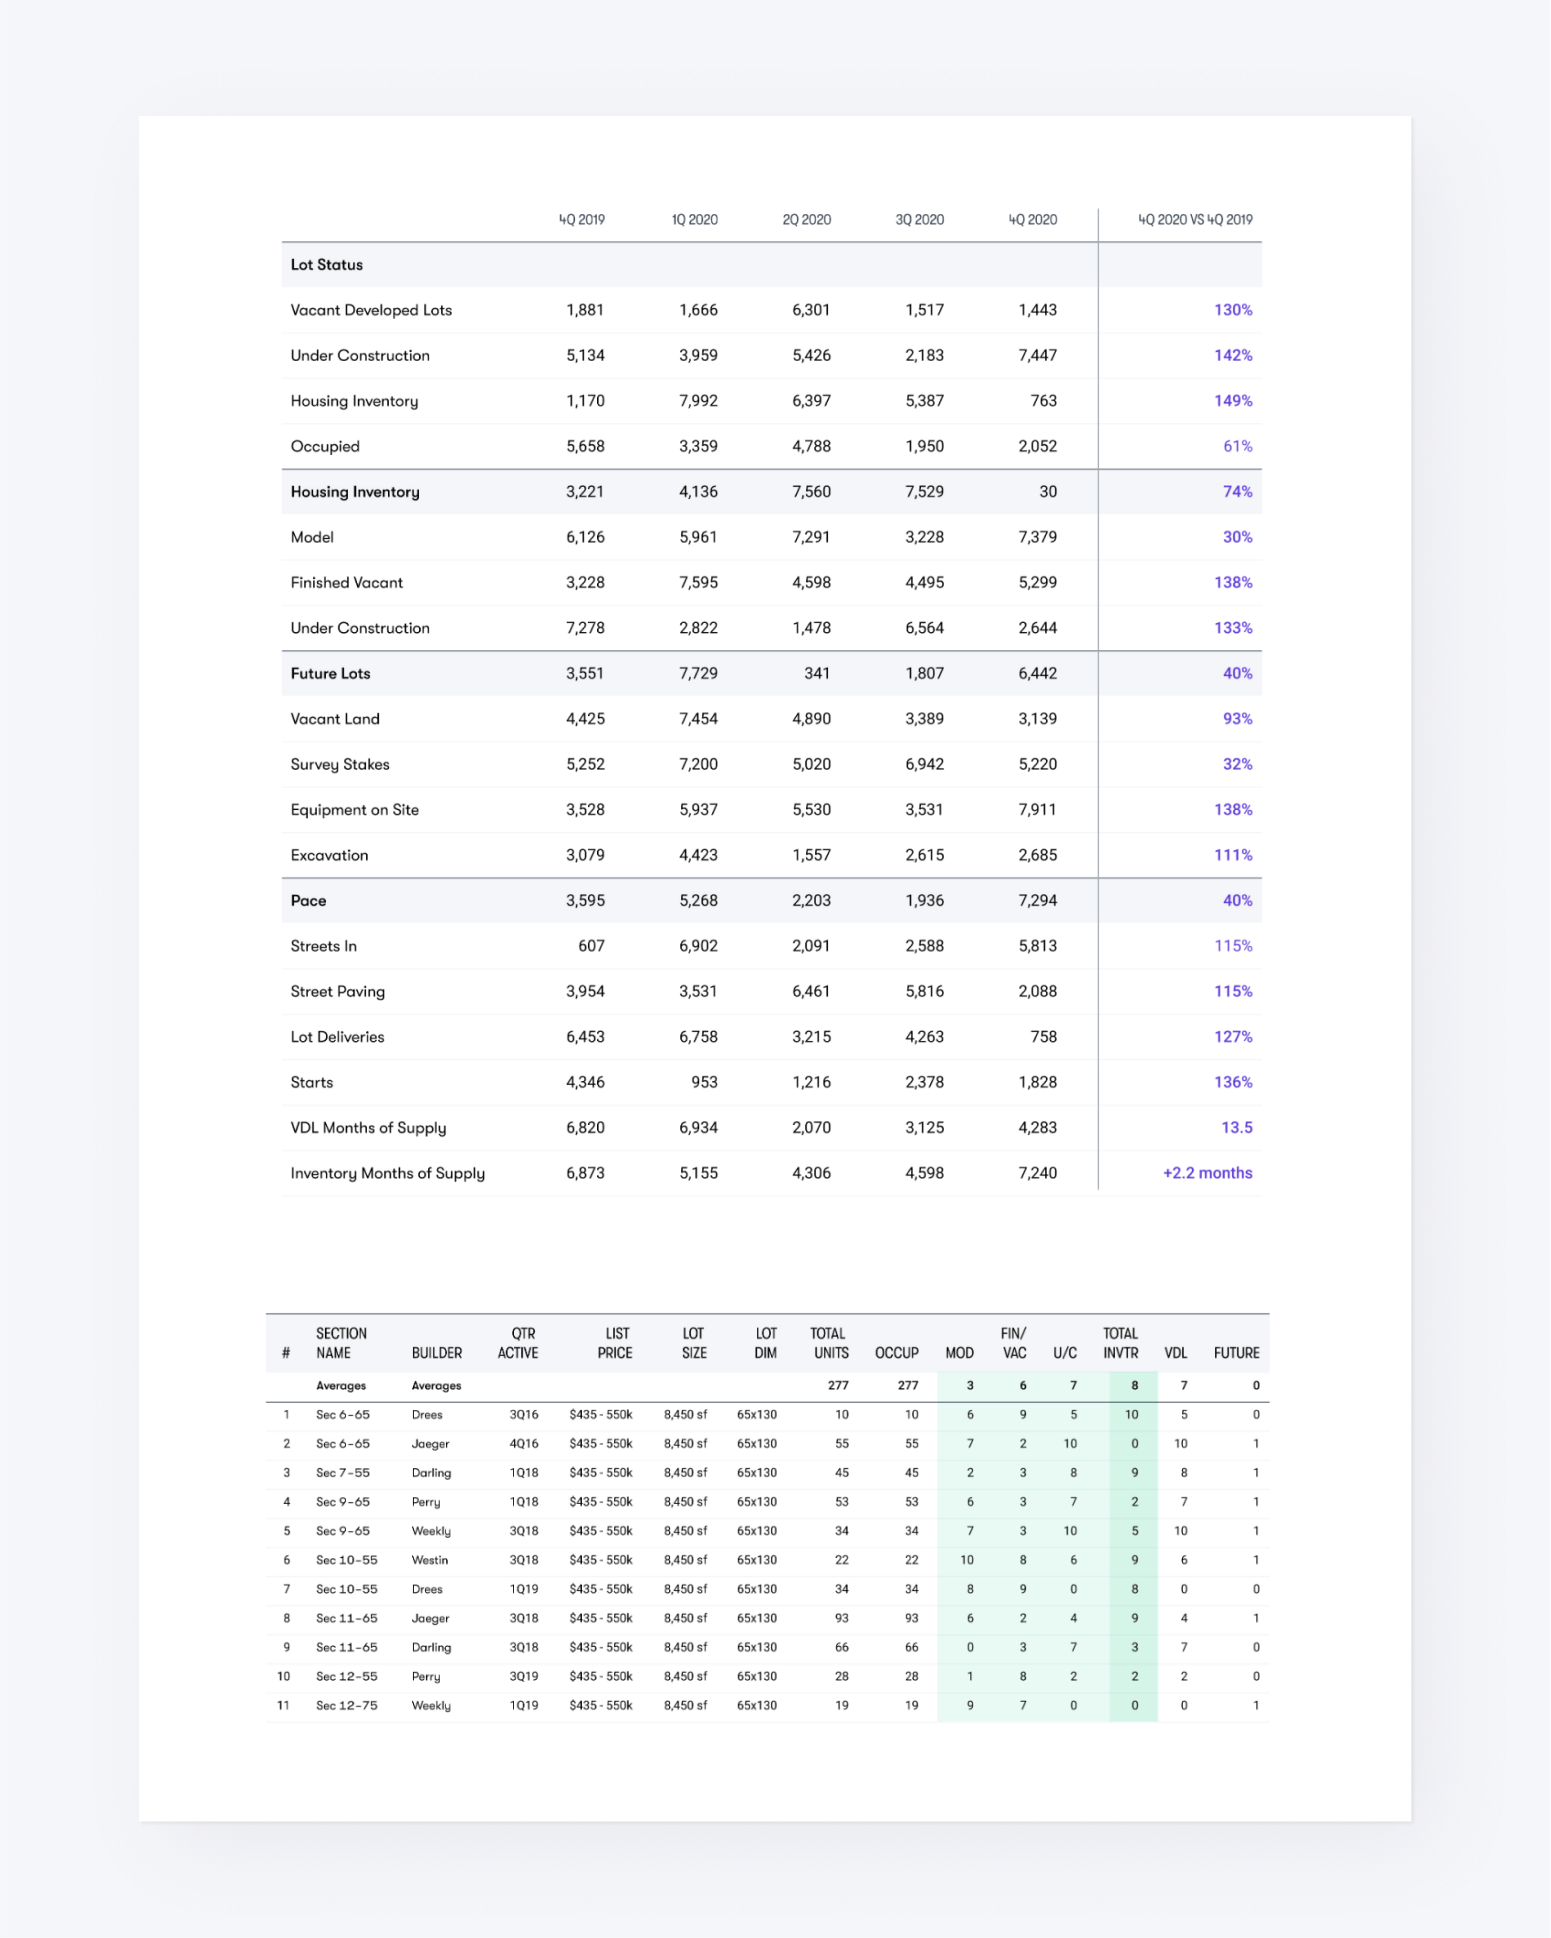
Tables had many variants and were designed in S,M,L sizes to accomidate various amount of data.
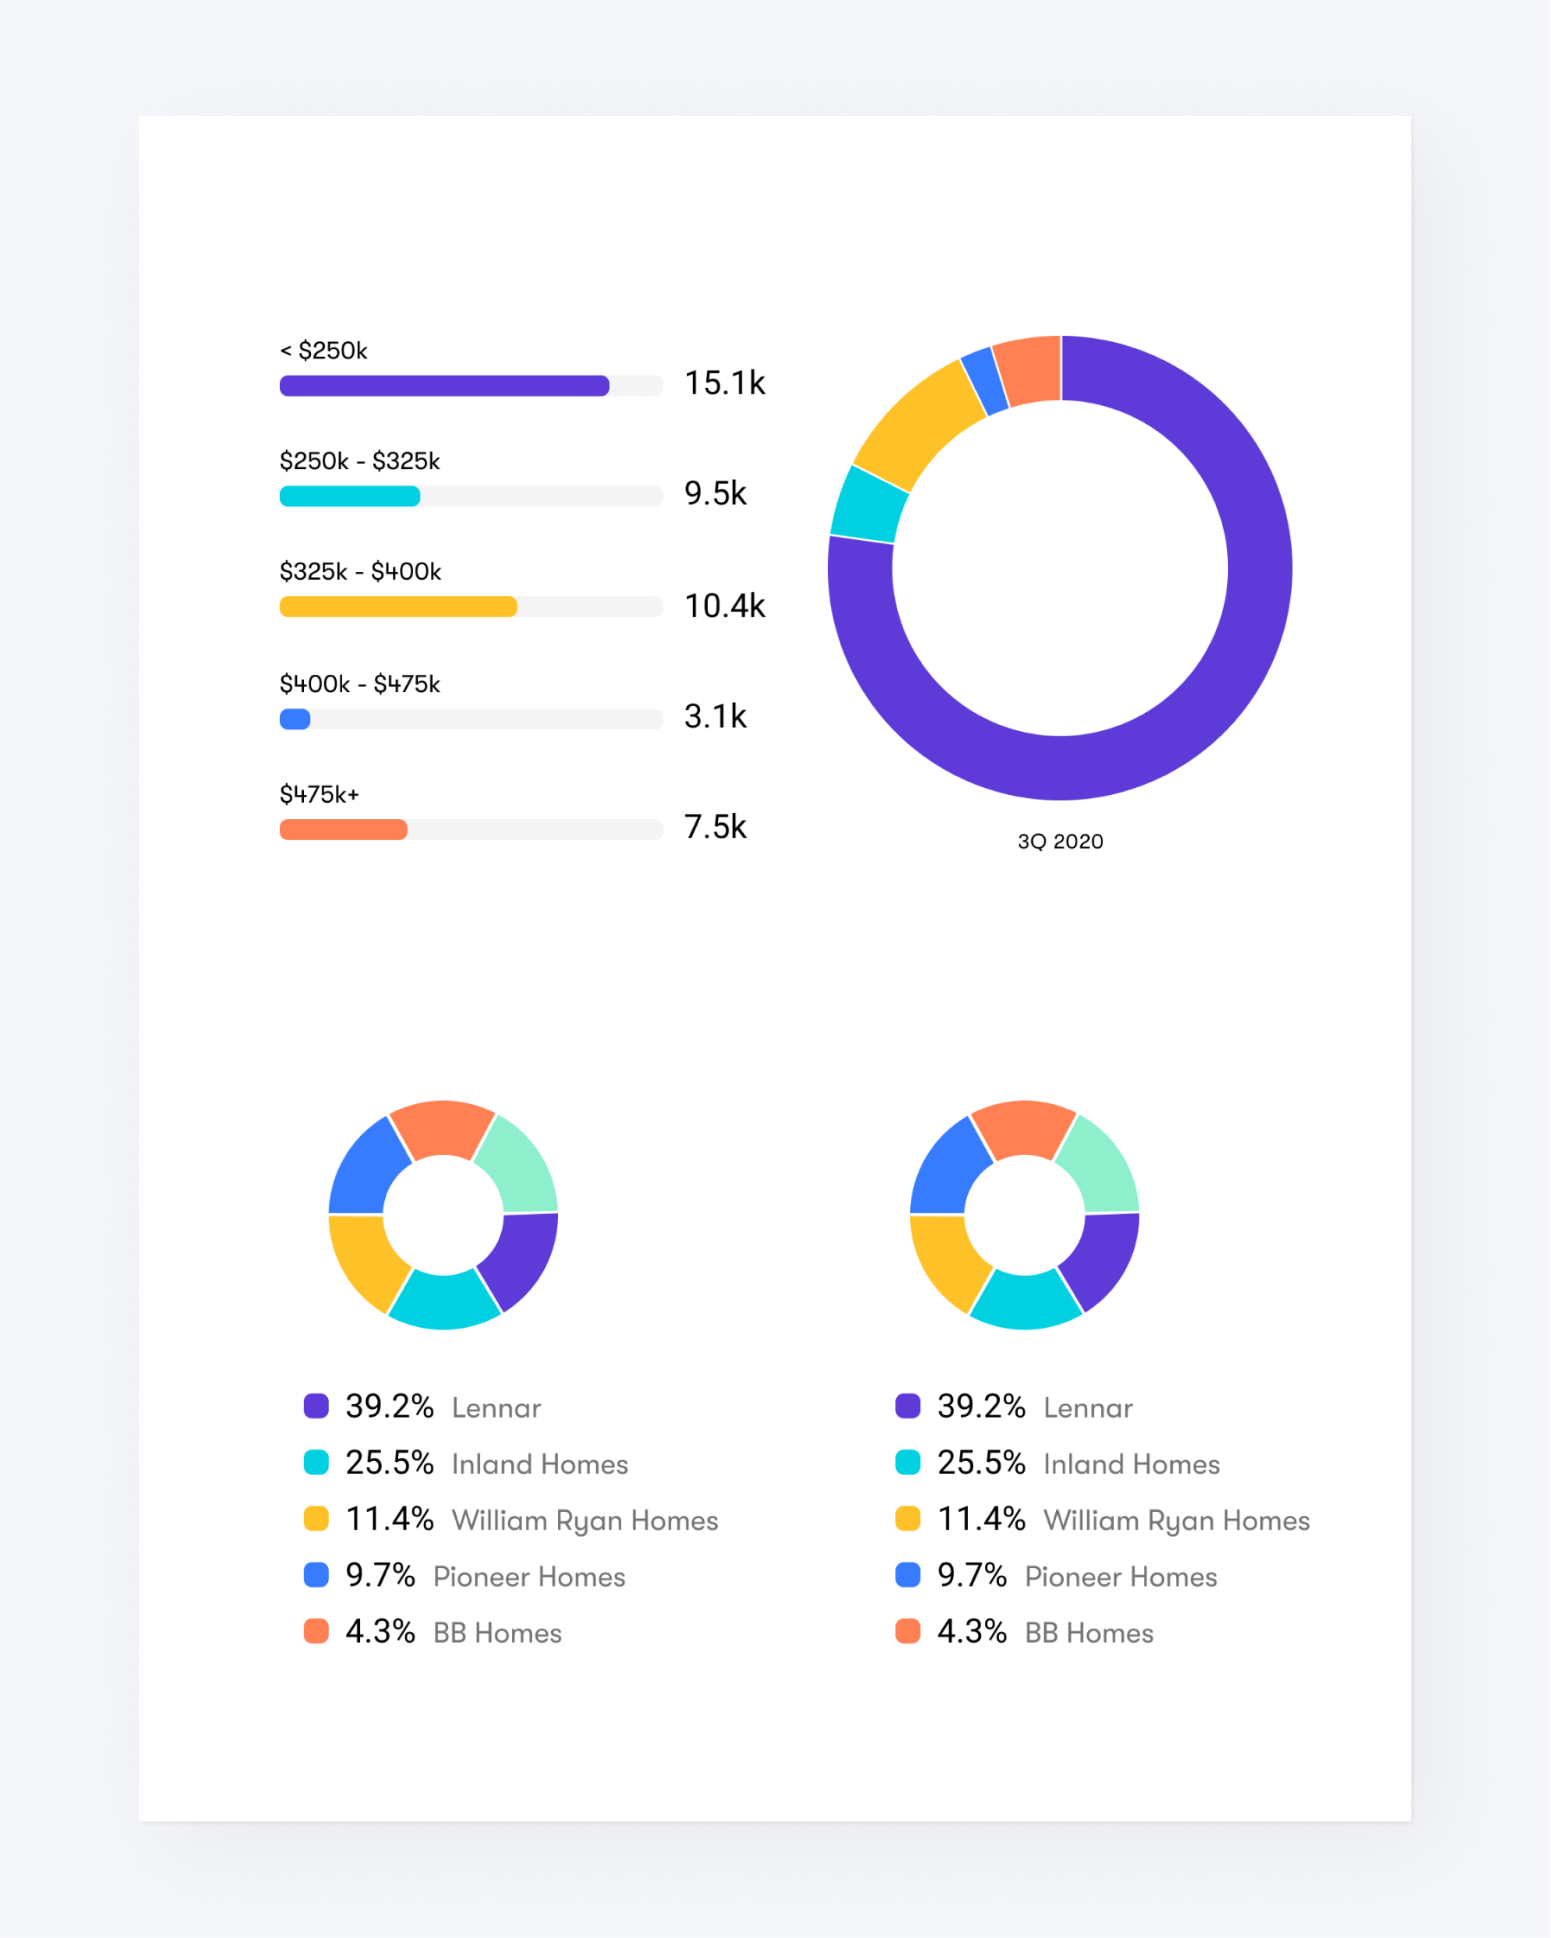
Pie charts brought softness to the chart system and helped to break up visual monotony.